Der Doomsday Bären-Thread
Stöffen: Den Pfizer Thread findest Du, wenn Du auf meine ID klickst; dann kommst Du zu meine Ariva-Startseite, wo der Link steht (unter "beste Postings von...")
Angehängte Grafik:
big.gif (verkleinert auf 88%)
big.gif (verkleinert auf 88%)
Dank * Stöffen
Was also passiert ist, dass der Spekulant kaum jemanden findet, der genug Miete bezahlt, um auch nur die Zinszahlungen zu decken. Wird das Haus billiger vermietet, zahlt der Besitzer auf unabsehbare Zeit die Zins-Differenz aus eigener Tasche. Das wird er sich daher kaum ans Bein binden. Fallen dazu noch die Häuserpreise (fängt gerade an), verliert das Haus während der Vermietung auch noch mit der Zeit an Wert, während die Schulden für den Hauskauf auf der alten Höhe verharren.
All dies spricht dafür, dass Spekulanten das Haus dann doch lieber - billiger - auf dem Markt verkaufen, was den Druck auf den Häusermarkt weiter erhöhen wird. (Für einen günstigen Preis ist jedes Haus verkäuflich, nur macht der Spekulant dann halt einen Verlust.) Alternativ meldet der Spekulant persönlichen Konkurs an; dann bleibt die Bank auf den Schulden sitzen, da sie bei der Zwangsversteigerung weniger bekommt, als sie vorher dem Spekulanten für den Kauf geliehen hat. (Dies ist ein Grund, warum der US-Bankenindex jetzt schwächelt - Chart in # 1077).
Hinzu kommt, dass die meisten neu gegründete Familien sich zurzeit kein Haus kaufen können, weil Häuser für sie einfach unerschwinglich geworden sind. Folglich mieten sie Häuser, was die Mietnachfrage und somit die Mieten hoch treibt. Mieten bzw. owner's-equivalent-rent fließen aber stark in den CPI ein. Die Inflation wird daher steigen. Die in P. 1072 erwarteten Zinssenkungen wird es daher nicht geben - zumindest nicht wegen fallender Mieten.
Stock Showdown Part II, Home Depot Versus Lowe's
A Technical and Sentiment Comparison of Home Depot (HD) and Lowe's (LOW)
Yesterday, I compared the two largest retailers on a technical and sentiment basis. Today, I am turning my technical and sentiment microscope to the world of home improvement, as I examine both Home Depot (NYSE:HD) and Lowe's Companies (NYSE:LOW) from a technical and sentiment perspective.
First things first; Hoover's states that HD is the world's largest home improvement chain and the second-largest retailer in the U.S. (following only Wal-Mart (WMT), one of yesterday's subjects). HD operates more than 2,000 stores in each of the 50 U.S. states, the District of Columbia, Canada, Mexico, and Puerto Rico. LOW is the second-largest home improvement chain in the U.S., boasting 1,250 superstores in 49 states. The company has announced plans to expand into Canada in 2007. The twin titans of tack hammers were in the news yesterday after Goldman Sachs downgraded HD while upgrading LOW. Thanks to the brokerage move, HD lost more than one percent while LOW added more than 0.5 percent. Today, HD has shed an additional one percent as LOW has lost more than two percent.
Technically, the past two days have pushed HD below prior support at the 36 level. The stock may find a bit of resistance at this level, as former support has a tendency to switch roles and act as resistance when given the chance. Looking at the daily chart below, I see two major areas of concern. The first is the 37.50 level, which is the site of peak call open interest in the October and November option series, which could act as resistance (for an explanation of why this is true, click here). In addition, HD's 10-day moving average is slightly below the 37.50 level and appears to have rolled over and is pointing lower.
Further potential resistance is found on a monthly chart for HD as well. The shares have retreated from their 10-month moving average during the past seven months; this is an upsetting development for two reasons. The first is that this trendline acted as support in the past, which could lend a bit of resolve to its new position as resistance. The second reason is that, like its 10-day counterpart, this trendline is in the process of descending in the general area of 37.50. This double-barreled resistance could be more than the shares can overcome. Now, there is some measure of potential support in the form of HD's half-high of 35. Unfortunately, a breach of this level could result in its assumption of the mantle of resistance.
The 35.00 level may be the only reliable support that HD can find, as one percent of its float is sold short, and it would take two days to buy back these shorted shares at HD's current average daily trading volume. Despite HD's recent struggles, the speculative options crowd remains bullishly aligned toward the king of caulk. The firm's Schaeffer's put/call open interest ratio (SOIR) of 0.58 is lower than 36 percent of those taken during the past year. Finally, 10 of the 18 analysts covering HD rate it a "buy" or better. While the eight remaining "hold" ratings could be upgraded, which could push the stock higher; the risk of negative pressure from downgrades is equal if not greater. When looking for direction on HD, its Schaeffer's Equity Scorecard comes in at 5.0, indicating that the stock could be stagnating.
We'll now switch gears and take a look HD's closest competitor. While it appears that the stock has found a bit of resistance at the 31 level, the good news is that the 30 level is the site of peak put open interest in the front three months options series. This collection of bearish bets could provide support if needed. In addition, the round-number 30 level acted as both support and resistance in the past. On the flip side, there is little in the way of overhead call open interest to stifle the stock, and it is poised to move higher as its 10-week moving average works its way north. Should this trendline continue its ascending pattern, it will complete a bullish cross of its 20-week cohort. This technical formation is often the precursor of a continued move higher.
The long-term picture for LOW reveals another potential layer of support. Yes, the shares have pulled back a bit today, but it appears that the equity's 50-month moving average is ready to act as support. Notice that this trendline has guided the shares higher without fail since 1996. As this powerful moving average continues its ascent, watch for the stock to tag along for the ride. Earlier I said that there is little in the way of overhead resistance; that isn't exactly the case. LOW's all-time high is 34.85, which turned the shares away this past February. LOW could be set up for a bit of a showdown at this level if its 50-month trendline continues its upward pattern.
LOW's sentiment backdrop sets up similarly to HD's, as far as short interest and analysts are concerned. Zacks does show that there are 10 "hold" ratings compared to eight "buy" or better ratings. This configuration affords room for potential upgrades, which could push the stock higher. The second-rated seller of screwdrivers also has a tad more in the way of available float sold short, boasting slightly more than two percent. In addition, it would take four days to buy back the shorted shares, which could provide ample fuel for a short-covering rally on its own.
The aspect of LOW's sentiment that I like is the pessimism from the speculative options crowd. LOW's SOIR of 0.82 is higher than 90 percent of the past year's worth of readings. Should this bearish bunch finally decide that LOW is a solid performer; buying pressure could enter the picture to push the shares higher. Now, LOW's Equity Scorecard rating of 6.0 isn't much better than HD's 5.0; however, I feel that the technical upside to LOW is far more promising than its larger competitor.
Much like yesterday's two subjects, HD and LOW will step into the earnings spotlight in November. Keep an eye on the short interest for these two. A build in bearish bets could help add more potential short-covering support, which we like to see ahead of an earnings report.
So we have similar sentiment (with the exception of LOW's SOIR), so let's turn to a monthly relative-strength chart to settle this score.
Since 2000, LOW has soundly outperformed HD, but has it hit a top? Keep an eye on LOW's support to see if it will continue to push the guru of wood glue higher still.
Click the following link to see a Daily Chart of HD Since February 2006 With 10-Day Moving Average, a Monthly Chart of HD Since January 1999 With 10-Month Moving Average, a Weekly Chart of LOW Since May 2003 With 10-Week and 20-Week Moving Averages, Monthly Chart of LOW Since January 1995 With 50-Month Moving Average, and a Monthly Relative Strength, LOW vs. HD, Since November 1991: http://www.schaeffersresearch.com/wire?ID=17562 .
Take advantage of the timely Schaeffer commentaries by signing up for their free e-newsletters -- Opening View, Market Recap and Monday Morning Outlook. Click here to have the Schaeffer's commentaries delivered to you free via email every day and get entered to win an iPod Nano. http://www.schaeffersresearch.com/redirect.aspx?CODE=PROAW13M&PAGE=1 .
About Schaeffer's Investment Research (www.SchaeffersResearch.com)
Schaeffer's Investment Research, founded by Bernie Schaeffer in 1981, is a financial information and trading resources company. It publishes Bernie Schaeffer's Option Advisor, the nation's leading options subscription newsletter. The firm's contrarian approach focuses on stocks with technical and fundamental trends that run counter to investor expectations. The firm's website, http://www.SchaeffersResearch.com , is recognized as one of the leading information sources for stock and options traders and was cited as the top options website by both Forbes and Barron's. Click here for more details about Schaeffer's trading methodology: http://www.SchaeffersResearch.com/method .
Daß ein IPO der Gagfah-Raffkes 10 x überzeichnet ist amS unerkärlich, ja unfassbar.
Haben sich die Gehirnamputierten seit 2000 deutlich vermehrt ?????
Gruß + Stöffen
(Etwa der Moebius, der Ihr unter Doppel-ID sein Unwesen treibt).
Damit genug der Zeitvergeudung , Ignore Button und tschüss.
ich bitte Dich, das vormals gepostete nicht als eigene persönliche Anmache aufzufassen, Du / Ich weisst, weiss selber nur zu gut , wie schwierig es ist , die Rosinen zu picken.
Deshalb rock steady my friend.
Gruß + Stöffen
"Antis genialer Pfizer Thread hatte mich seinerzeit dazu inspiriert, Pfizer auf nahezu Tiefstständen zu erwerben. Dafür möchte ich mich bei A.L. nochmals herzlichst bedanken.
( Finde gerade diesen Pfizer Thread nich', Sorry und Dank an A.L. )"
Das solltest du doch einfach nochmal überdenken, da fehlen einem einfach die Worte..
Ich selber habe Pfizer, ähnlich wie Intel, die ganze Zeit über getradet (mit einigen mehrmonatigen Haltephasen) und hatte im November 2004 auch mal Puts gekauft beim Stand von 29 Dollar - was sich durch etwas Glück als einer meiner besten Trades überhaupt entpuppte, da Pfizer einige Tage später von 29 auf 23 USD abstürzte. Am Tief bei 20 USD (Dezember 2005) hab ich die Pfizer-Long-Position massiv ausgebaut und auch langlaufende Calls auf Pfizer gekauft. Nach dem positiven Lipitor-Urteil [was die Grundlage für die Pfizer-Spekulation bildete] habe ich alles im Januar 2006 bei rund 24,60 USD (VK gepostet) mit passablem Gewinn abgesetzt. Das war die Zeit, als ich mir über die Makro-Ökonomie Sorgen zu machen begann, Long-Engagements (bis auf Intel und Microsoft) zurückstellte und diesen Doomsday-Thread aufmachte. Das Ganze sollte auch für diejenigen interessant sein, die mich hier als Permabären abstempeln.
Alle Trades in Pfizer, Intel und Microsoft (und einigen anderen Aktien)zusammen lieferten ein Ergebnis, das etwa dem entspricht, das ich erzielt hätte, wenn ich im Nov. 2004 einfach nur "long" den DAX gekauft hätte, was freilich weniger Mühe bereitet hätte. Dies auch als Hinweis auf die vielen Leute hier, die behaupten, ich wäre auf dem Weg nach oben als Shorter "ausgeblutet". Das ist schlicht Unfug. Die meiste Zeit war ich long. Aktiv short mit Puts auf die Indizes bin ich erst seit Ende August/Sept., wobei ich die ersten, zu früh gekauften Puts stets mit kleinem Gewinn bei Kursrücksetzern loswerden konnte (VK hier gepostet). Meine jetzige Put-Position auf den SP-500 ist ca. 14 Tage alt. Sie wurde beim Stand von 1350 aufgemacht, Mittwoch hab ich bei 1370 noch ein paar Puts zugekauft. Gestern schloss der SP-500 bei 1368. Bei Rücksetzern auf 1320 würde ich die Position schon mal wieder etwas ausdünnen. Ich kaufe übrigens nur Optionen (meist langlaufende), nie Turbos, und bin daher auch noch nie ausgeknockt worden.
Kurz gesagt bin ich - daher "Anti Lemming" - bullisch, wenn die Indizes auf Langzeittiefs stehen [Bodenbildungs-Phase], und bärisch, wenn sie bei Allzeithochs stehen [Topbildungs-Phase wie jetzt]. Letzteres freilich nur, wenn der Anstieg IMHO fundamental nicht unterlegt ist. Ein englischer Freund von mir, der diese Haltung teilt, sagt: "Ich kaufe Panik und verkaufe Euphorie." Zum Glück handeln an der Börse die Wenigsten danach, sonst wäre es für Leute wie mich noch schwieriger, Geld zu verdienen ;-))
In 1080 wirbt Schaeffer dafür, jetzt US-Homebuilder wie Home Depot zu kaufen, weil die fundamental billig seien und die Housing-Blase ja gar nicht recht existiert. Solche Artikel, unkommentiert gepostet, sind nicht übermäßig erhellend. Außerdem liefert Schaeffer dort eine technische Analyse, während die Argumente hier im Thread überwiegend fundamental sind.
"Antis genialer Pfizer Thread hatte mich seinerzeit dazu inspiriert, Pfizer auf nahezu Tiefstständen zu erwerben."
Ich habe (verzeiht mir, war Mitten in der Nacht) versehentlich Tiefstständen mit Höchstständen verwechselt und dachte, du wolltest Anti für dein Verlustgeschäft verantwortlich machen. Aufgrund der jetztigen Tatsachen fehlen mir nicht mehr allzu stark die Worte ;-)
--------------------------
#1089 sagt es aber recht eindeutig; Stöffen, hast du den Artikel gelesen ?
Allen noch einen schönen Samstag
Market Shows Signs of Stalling
By Harry Schiller
TheStreet.com Contributor
10/20/2006 5:30 PM EDT
I don't see many reasons to buy stocks, but lots of reasons to sell.
The Dow Jones Industrial Average has accomplished its overhyped mission of breaking 12,000. That doesn't signal a big advance from here. The Nasdaq is lagging and lower for the week. Though seasonal patterns will turn favorable in November, a pullback is likely before then.
On Monday, the Dow got to 11,997 and pulled back, dropping 110 points from Monday's high to Tuesday's low, in the initial failure to crack 12,000 that I wrote to expect in last week's column. Then the Dow spurted to a new high as I had expected, just shy of 12,050, and another pullback immediately followed of over 100 points. Thursday it finally closed above 12,000, and from there we saw a somewhat artificial pop just shy of 12,050 Friday and another decline of more than 100 points to Friday's lows.
So who cares? The people who keep buying stocks above 12,000 ought to, because every time they do, they are suffering significant losses within minutes or hours.
The market is showing signs of stalling as the public becomes enamored with this blue-chip index and its ascension to higher and higher heights. While the media talks it up, the inference is made that it is only going much higher.
I even heard a well-known CNBC reporter tell us that the next 10,000 points in the Dow would be achieved much more quickly than the last 10,000 ... so apparently the Dow is headed for 22,000. It's just a fact. This is what it looks like at tops as the market gets set up for a tumble. Maybe not a meltdown or a crash, but a correction.
The VIX/SPX chart below tells the same story. Very little fear is evident in this indicator. This makes me continue looking for spots to sell short, not to buy. Thursday at the close I shorted Rydex Dow funds, and I took some quick profits Friday morning. I'll continue to do this on a short-term basis until it stops working.
VIX (Chart unten)
The chart below of the Dow only goes back to the beginning of the new millennium, so it doesn't show the first attempt to pop above the 11,000 level in 1999. However, you get the idea that the Dow (as well as other averages) looks like it has reached the promised land. At a minimum, I believe a pullback to the prior highs at the 11,750 level is a reasonable expectation. It may not happen over the next few days or even before the end of October (though I suspect it will). But regardless of when, I believe it will happen.
Dow Industrials Chart (weggelassen)
While the Dow has been busy setting records on a daily basis, the Nasdaq has been off doing its own thing. The composite stalled Monday just shy of its multiyear double-top highs and then collapsed 38 points to Tuesday's lows. After Wednesday's opening pop back into Tuesday's gap, it pulled back to lower lows.
The composite still has a bit of an overhead gap from Monday's close, which will require a move up to the 2364 level to fill it. Any move above this gap should challenge the nearby highs at 2368 and then, if exceeded, likely head up to the prior double-top highs at 2375.54. If it gets through there, and that's a big if, there should be another pop to higher highs, likely to soon be followed by another pullback to 2375.
Initial support is at the 2324 level; below that is the gap from last Thursday at the 2308 level, which may be the worst case for the very near term.
Despite the relative weakness on the Nasdaq, the Nasdaq 100 bottomed Thursday and again today just above the top of last Thursday's gap at 1691.27. The bullish news was that the NDX didn't crack below the bottom of the gap. It didn't quite fill the gap, bottoming at 1693.11 Thursday. It then bounced to the 1713 level, pulled back to a slightly higher low and on Friday pulled back to a slightly higher low and bounced again. This has near-term bullish implications, as a break below the bottom of the gap would not be a good sign.
Below I have labeled the Oct. 12 gap "almost filled." Maybe for now that's close enough. As the NDX pulls back to its Oct. 12 gap, I have been covering short positions in this sector.
S&P 500 futures have been maintaining a small trading range bounded by Wednesday's high at 1380.20 and the recent low of 1364.20. Nothing conclusive here, but a pop above 1380 would point higher, maybe up to my new target at the 1390 level, around the highs from Jan. 21 (the high in the cash index was 1383.37).
The recent low at 1364.10 is still near-term support. A break of that level would likely point to support at 1360 and a probing of the Oct. 12 gap.
Angehängte Grafik:
102006vixspxSchiller.gif (verkleinert auf 70%)
102006vixspxSchiller.gif (verkleinert auf 70%)
Angehängte Grafik:
102006spzSchiller.gif (verkleinert auf 90%)
102006spzSchiller.gif (verkleinert auf 90%)
Ich hoffe, dass mein Statement nicht deplaziert ist.
Gruß + Stöffen
Sräd interpretiert. Ihre Kommentierung zu meiner Einschätzung des Immmobilien-Hypes in Deutschland (angeblich sind hier Immobilien billig, mir liegen allerdings andere
Infos vor, z.B. Grundstückspreise von 1200 €/m² in München, mittlere Lage) war ambivalent. Sollte ich diesbezüglich falsch gelegen haben, Sorry !
Ich bin weiter der Auffassung ,daß raffgierige Firmenvorstände den Börsengang suchen, um Schnellkäufe von Immobilienbestand zu realisieren. Anschließend werden die Mieter gemolken (fast money). Für mich ist das Raubtier Kapitalismus und kein
Geschäftsmodell. Ich bin entsetzt über das Gagfah Ipo,
wo selbst der Vorstand (!!!) von einem ambitionierten IPO-Preis gesprochen hat.
Eine gefährliche Tendenz .
Al zeigt fundiert Tendenzen auf, die eigentlich für jeden Boardteilnehmer
hilfreiche "Tools" darstellen sollten.
Optionen
| Boardmail an "lumpensammler" |
Wertpapier: BP plc |
Optionen
| Boardmail an "lumpensammler" |
Wertpapier: BP plc |
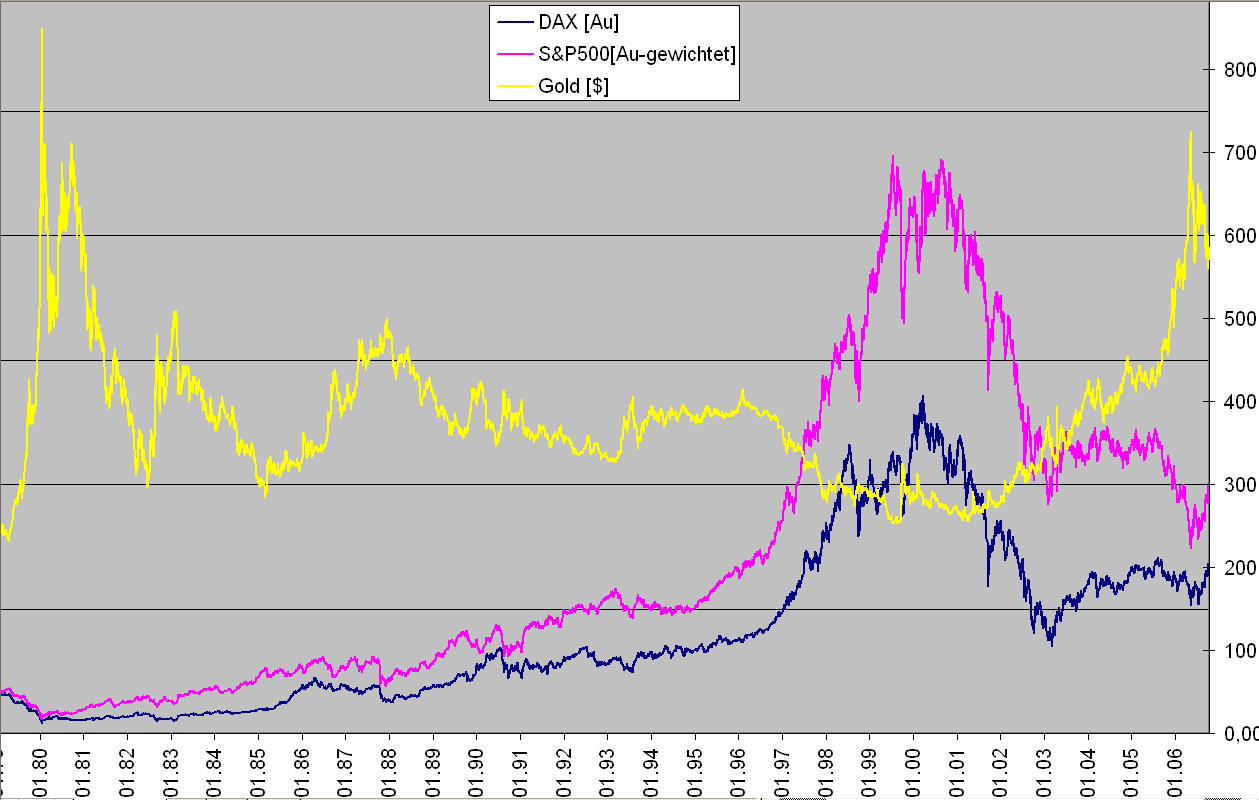
Angehängte Grafik:
Gold-Indizes.jpg (verkleinert auf 40%)
Gold-Indizes.jpg (verkleinert auf 40%)

Da stecken doch fatale Fehler drin.
Der Dax wird von Euro durch den Goldkurs (in Euro) in Gold umgerechnet, der SPY von Dollar durch den Goldkurs (in Dollar) ebenso. Beides jeweils auf Tagesbasis. Anschließend wird der SPY noch mit einem konstanten Faktor multipliziert, damit Dax und SPY zu Beginn des Charts auf den gleichen Punkt fallen, und somit eine rel. Entwicklung da ist. Man könnte es auch umgekehrt machen oder den Faktor ganz weglassen. Dann würde es halt weniger offenscichtlichund der SPY würde auf tieferem Niveau mit weniger großen Auschlägen dargestellt.
Fehler sind da keine drin. Außerdem unterstützt der Chart doch dein Inflationshorrorszenario, müßtest eigentlich glücklich sein.
Optionen
| Boardmail an "lumpensammler" |
Wertpapier: BP plc |