Der USA Bären-Thread
Seite 532 von 6257 Neuester Beitrag: 03.02.25 16:52 | ||||
| Eröffnet am: | 20.02.07 18:46 | von: Anti Lemmin. | Anzahl Beiträge: | 157.409 |
| Neuester Beitrag: | 03.02.25 16:52 | von: Katzenpirat | Leser gesamt: | 24.296.872 |
| Forum: | Börse | Leser heute: | 2.068 | |
| Bewertet mit: | ||||
| Seite: < 1 | ... | 530 | 531 | | 533 | 534 | ... 6257 > | ||||
Wieso schreckt sie ab?
3 Analysten sagen strong buy. (auf onvista):
http://aktien.onvista.de/snapshot.html?ID_OSI=86143
Optionen
| Boardmail an "Casaubon" |
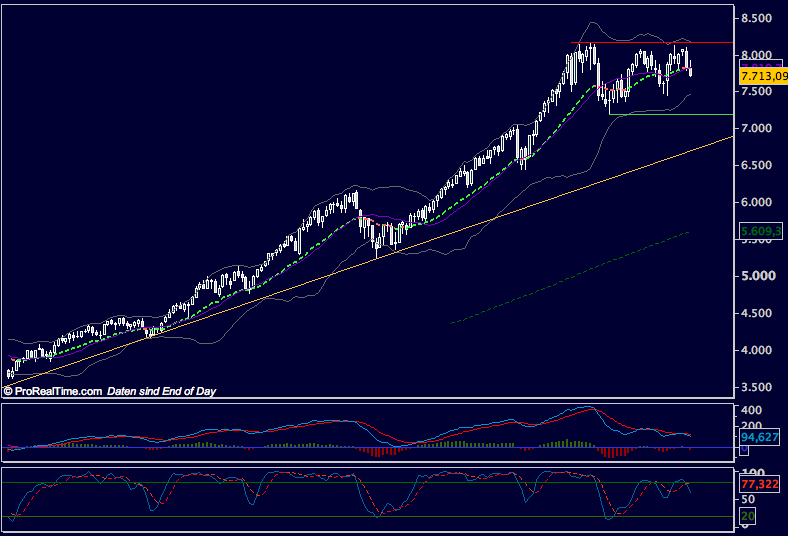
Wertpapier: S&P 500 |
Angehängte Grafik:
h.gif
h.gif
Die Widerstände sind nur zu Illustrationszwecken eingezeichnet - Tiefs von 7000 und Hochs von 8500 wären genauso denkbar. Höhere, und vor allem tiefere Notierungen halte ich für unwahrscheinlich. Warum? Einfach so.
Damit ab in's Wochenende - ich hoffe, in München ist gutes Wetter!
Beste Grüße,
w.
Angehängte Grafik:
dax_weekly_080110.png (verkleinert auf 64%)
dax_weekly_080110.png (verkleinert auf 64%)
In so fern müsste man eigentlich dem Nikkei-Langzeitchart - zumindest aus meiner Sicht - noch die Langzeitcharts des Dow, des Dax, des ES etc. an die Seite stellen, dann sähe das schon wieder anders aus. In meinem Fall sind es gerade die langfristigen Engagements, eon, DBK, MüRü, ... die letztlich die Performance des Depots durchweg gut aussehen lassen (selbst wenn neuere Investments abschmieren, steht denen immer noch >100% bei einigen anderen gegenüber).
Emil Heinrich du Bois-Reymond
http://de.wikipedia.org/wiki/Ignoramus_et_ignorabimus
;o)
Meine damalige tiefgründige charttechnische Analyse:
Die Landezone im Bereich 4000 ist sehr stark betoniert und wird ziemlich sicher halten. Die Zonen bei 6000 und 5000 sind nur Sandpisten. Da kann ein Flugzeug schnell verunglücken. Besser wir testen sie nicht.
Spaß muss sein, sprach Wallenstein, und schob .....
;o)
Am 22. März 1832 starb Goethe an den Folgen einer Lungenentzündung in seinem Sessel. (...) Seine berühmten letzten Worte sollen gelautet haben „Mehr Licht!“. )
Habe erst jetztgeschnallt, um welches Dienstleistungsunternehmen es sich handelt.
Pas mal
;-))
Casaubon
Optionen
| Boardmail an "Casaubon" |
Wertpapier: S&P 500 |
Optionen
| Boardmail an "Casaubon" |
Wertpapier: S&P 500 |
Optionen
| Boardmail an "obgicou" |
Wertpapier: S&P 500 |
Angehängte Grafik:
gabel.jpg (verkleinert auf 66%)
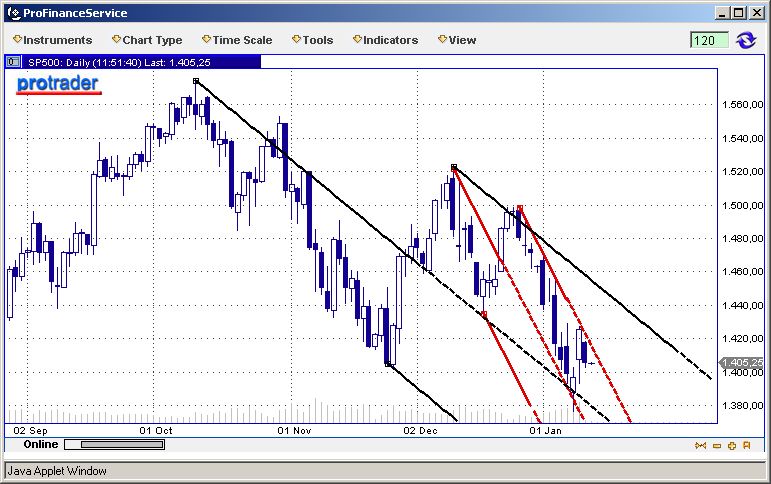
gabel.jpg (verkleinert auf 66%)
mit vielen schönen Bildchen a la wawidu,müsst ihr ahlt mal anklicken
FROM A TECHNICAL PERSPECTIVE, something very important happened in the stock market over the past week. Key support levels on all major indexes have been broken to the downside. Whether you think the economy will rebound or not, the stock market is signaling that the pain is not over.
To be sure, after the losing streak the market has had since late last month, there are a few reasons why prices can rebound in the short term. One of them comes from momentum indicators, such as the relative strength index, that show selling pressures have let up a bit despite the trip to new multimonth lows.
But just because there are reasons to go up or down does not mean the market will oblige. Just last August 16, when the lid blew off the subprime crisis, the Dow Jones Industrial Average plunged more than 300 points intraday in what looked like a major breakdown (see Chart 1). The bull market appeared to have been broken.
Fear levels soared and the Chicago Board Options Exchange volatility index (VIX) rose above 37, a level last seen during the bear market in 2002. But when sentiment indicators such as the VIX move to extreme levels of negativity the market usually bottoms. Theoretically, if "everyone" is bearish then there is nobody left to sell and no supply to satisfy even the slightest uptick in demand.
Such was the case in August 2007. Contrarians started to buy at the lows of the day to erase the entire decline, and the next day the Federal Reserve cut the discount rate by half a point in a surprise move. Stocks were off to the races and on to a new all-time high within eight weeks.
That was then and this is now. With the Dow trading below its August 16 closing low of 12,846, it would seem that conditions are once again ripe for a bottom. But this time the fear element normally accompanying bottoms is missing. The VIX hit 25 Tuesday -- a far cry from its peak last August. It is also well below the 31 it hit as the market troughed in November.
Last week, I discussed how the pause of 2007 was different from other pauses seen since the bull market began in 2003, adding, "For the first time, big selloffs are not being followed by sustained rallies." (see Getting Technical, "The Technical Setup for 2008," Jan. 2).
As mentioned, the rally from the August low lasted eight weeks; prices rolled over to head back down. The rally from the November low lasted two weeks and could not get close to setting new highs -- this is not how previous pullbacks acted. With the Dow still falling, it has notched a lower low to go along with its lower high to meet the classic definition of a declining trend.
Where will it all end? I am not going to make a prediction but using a simple measuring technique we can get an idea of magnitude. In round numbers, the 2007 trading range was between 12,800 and 14,100. Chart watchers take that height -- 1300 points -- and project that down from the breakdown point. The result is 11,500, a level last seen in early 2006.
That is certainly not the end of the world although it will do a number on investor portfolios and attitudes. It also does not prohibit a strong rebound in the latter half of the year to turn red ink into black. But let's get through the first half of the year before thinking that far out into the future.
As always, every analysis must include a look at what has to happen to prove the conclusions to be wrong. Excluding outside influences, such as a massive rate cut by the Fed or making nice with our enemies, the technical proof that the decline from all-time highs was corrective -- and not the start of a new bearish trend -- will be a move back above 13,400 (see Chart 2).
A trendline drawn from the October peak through the December high is now the technical feature to watch. If in a few weeks the Dow can move above 13,400, then I will have to concede that this month's breakdown was a false signal and that new highs would be in the cards. This is a bit different than what I wrote last week, looking for a new high above October's all-time high of 14,198, because last week the trading range was not broken. Now it is.
I'd like to wrap it up with a quick look at the Standard & Poor's 500 since it is the benchmark against which most money managers are judged. Many analysts are still looking at this index as holding above its long-term trendline and technically still in a bull market (see Chart 3).
I disagree with the conclusion, mainly because the trendline as seen in the chart has not accurately reflected the action since July 2006. In other words, I am looking at a different pattern to tell me if the bull market is over or not. What I see has several interpretations from a "double top" to a complex form of "head-and-shoulder" with a double "head." No matter what the jargon, the pattern has broken down.
Using the same technique to project a target as we did for the Dow, it looks as if the S&P 500 can head to 1250, also a level not seen since 2006.
The bottom line is that the bull market is over. A bear market is not necessarily the next step but at this point, barring outside influences, the stock market has a lot of healing to do before it will be strong enough to sustain another leg up.
http://online.barrons.com/article/...html?mod=barrons_most_viewed_day
Angehängte Grafik:
dow.jpg
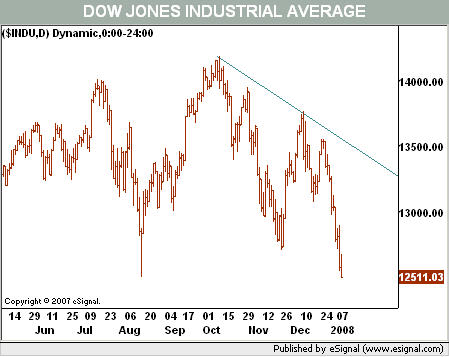
dow.jpg
Arbitrage-Idee: CFC jetzt in Frankfurt shorten? Sind wohl schon andere drauf gekommen...
Bank of America may buy Countrywide for $4 bln: report
By Steve Goldstein
Last update: 5:45 a.m. EST Jan. 11, 2008
LONDON (MarketWatch) -- Bank of America (BAC) may buy Countrywide Financial (CFC)for slightly more than $4 billion, The New York Times reported Friday, citing people brief on the transaction. Directors for both companies have approved the deal, which is expected to be announced Friday, the report added. The deal would be worth nearly $500 million less than Countrywide's value on Thursday, but because it's an all-stock transaction, Countrywide investors will benefit if Bank of America's stock rises, the report added.
Die DAX4000 Strategie ist gut. Ungehebelt verdoppelt man alle 4 Jahre, entweder als Bulle oder als Bär. Wer "outet" sich mit einer besseren Performance? ;-)
Und zum US-Thema: Nach Bens Rede stieg EUR/USD um ein knappes Prozent, jetzt "dümpelt" es. Bei der Ansage müßte der doch "durch die Decke gehen" oder ist da "auch alles eingepreist"? ;-)
Optionen
| Boardmail an "relaxed" |
Wertpapier: S&P 500 |
11 January 2008
DUBAI — Standard & Poor's Ratings Services said yesterday that it assigned its 'BBB-' long-term rating to the $300 million unsecured credit facility of Emirates Trading Agency LLC, a fully owned subsidiary of Dubai-based industrial conglomerate ETA Group (BBB-/Stable/--). ETA Group is the combination of ETA-Ascon group of companies and ETA-Star group of companies.
The original borrowers under the facility are Emirates Trading Agency, Associated Construction and Investments Co. LLC (Ascon), and ETA Star Holdings Ltd. Jebel Ali. The loans under the facility will be guaranteed by material subsidiaries and affiliates of the borrowers, corresponding to at least 75 per cent of total EBITDA of ETA group. The facility has been rated at the same level as the corporate credit rating on ETA, reflecting the upstream guarantees and the implicit support factored into ETA's rating from its 52 per cent owner, the Al Ghurair family.
http://www.khaleejtimes.com/...s_January258.xml§ion=business&col=
Gruß
Permanent
1. die Reaktion der Asiaten auf die gestrige US-Entwicklung,
2. die DB-Indikationen für DOW und NDX,
3. die verhaltene Reaktion der deutschen Indizes.
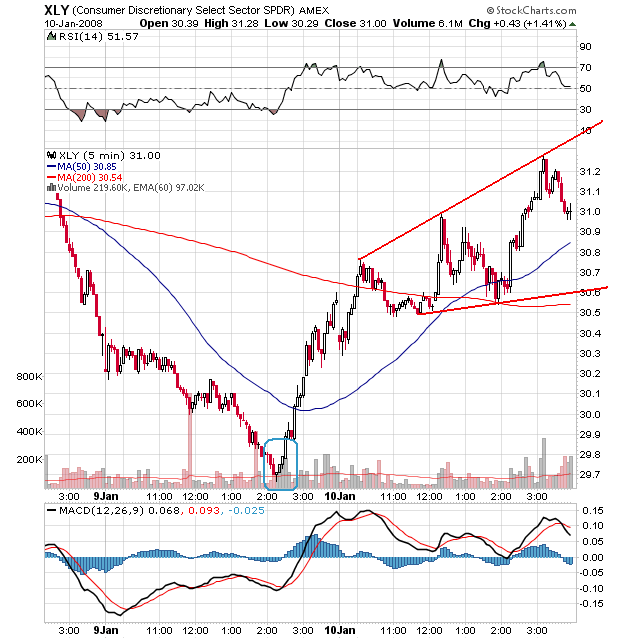
4. die 5-Minuten-Charts der US-ETFs. Deren "Rallies" begannen fast übereinstimmend bereits gestern kurz nach 20 Uhr MEZ. Als Beispiel im Anhang der Chart von XLY. Hier liegt eine klassische Megafon-Formation vor.
Angehängte Grafik:
xly5min.png (verkleinert auf 82%)
xly5min.png (verkleinert auf 82%)