Der USA Bären-Thread
Seite 526 von 6257 Neuester Beitrag: 03.02.25 16:52 | ||||
| Eröffnet am: | 20.02.07 18:46 | von: Anti Lemmin. | Anzahl Beiträge: | 157.409 |
| Neuester Beitrag: | 03.02.25 16:52 | von: Katzenpirat | Leser gesamt: | 24.293.531 |
| Forum: | Börse | Leser heute: | 5.355 | |
| Bewertet mit: | ||||
| Seite: < 1 | ... | 524 | 525 | | 527 | 528 | ... 6257 > | ||||
Das für mich wahrscheinlichste Szenario:
1. Peak Zwangsversteigerungen in den USA Ende 2008 / Anfang 2009.
(3-Monats-Leg aus ARM reset schedule) man kann diskutieren, ob die durch den Hausmarkt ausgelöste Rezession den Peak noch nach hinten verschiebt.
2. Erholung am US-Hausmarkt frühestens ab Q1 2009.
3. Peak Verluste aus RRE-MBS bei Banken weltweit früher (Q2 2008) durch Vorwegabschreibungen.
4. Kreditrestriktion und Arbeitsplatzverluste durch Hauskrise löst US-Rezession in Q1 2008 aus (spillover).
5. Spätestens ab Q2 2008 steigende Abschreibungen auf Kreditkartenportfolios und CRE-MBS.
6. Dadurch vom Mortgage auf den Konsumentenkredit ausgeweitete Kreditrestriktion.
7. Rezession in den USA erreicht Tief in Q3 2008, danach allerdings nur schleppende Erholung mit negativem Wachstum auch in Q4.
8. Ölpreis wird bis zum Jahresende (oder davor) auf 80$ sinken.
9. Am US-Aktienmarkt wird es in den nächsten Wochen keine nennenswerte Erholung geben.
10. Der Deutsche Aktienmarkt wird dem US-Markt folgen.
11. Im S&P500 sehen wir bis Jahresende (oder davor) mindestens 180 Punkte minus von heute aus (Kursziel des aufgelösten Diamanten), im Dow wären das die 11000.
12. Gold wir die 900 oder 1000 wegen Unsicherheit noch mitnehmen und dann auch sinken.
13. Inflation wird ab Q2 2008 kein Thema mehr sein.
14. FED wird Zinsen bis zum Jahresende mindestens bis auf 2% senken.
15. EZB startet spätesten in Q2 Zinssenkungen.
16. EUR/USD zur Jahresmitte Richtung 1,60 danach wieder fallend.
Optionen
| Boardmail an "obgicou" |
Wertpapier: S&P 500 |
Jobfront:
U.S. weekly initial jobless claims fall 15,000 to 322,000
U.S. initial jobless claims fall to 2-month low
Retailerfront:
Kohl's December reported same-store sales down 11.4%
Target's reported Dec. same-store sales down 5%
Ross Stores same-store sales up 3% in Dec
JCPenney December same-department-store sales down 7.5%
Family Dollar same-store sales down 0.7% in Dec.
Saks December same-store sales up 0.8% 
Um 16:00 kommen die Großhandelsdaten/Lagerbestände für November.
Benny wird etwas unternehmen müssen!
Da ist mir in der Eile was durcheinandergeraten...
:)
wir sind ich und alle, die auch sehen können ;-)
Optionen
| Boardmail an "obgicou" |
Wertpapier: S&P 500 |
An eine solche krasse Divergenz zwischen Kursentwicklung und Bärensentiment kann ich mich eigentlich seit meiner Teilnahme hier vor einem Jahr nicht erinnern. Nun denn, wir werden sehen wohin das führt.
Ups, der Dax ist heute ja ein echter Waschbär. Ob er hier mitliest?
;-)
Finde ich gut, dass du so sehr auf der Ariva-Sentiment achtest!
Ich würde mich freuen, wenn einträte, was du hier verkündest. Doch allein, der Glaube fehlt...
Tecdax - 10%
MDAx - 10%
Sdax - 8%
Dax - 4% !!!!
Auch so: Dax-Wert "Metro" heute +6%. Haben die etwa Einblick in meinen Depotstand?
;-)
http://www.ariva.de/Der_USA_Bullen_Thread_t307549#bottom
Meine Theorie: Wenn die Konjunktur auch hier abrutscht wird es die EU härter treffen als die USA, weil die EZB nicht so stark stützen wird wie die FED.
Somit erklärt sich auch das Timeleg zwischen den US-Märkten und dem EU-Markt.
Im Sommer, als alles perfekt schien, war der ideale Einstiegsmoment für antizyklische Shorts. Jetzt, wo alles im Eimer scheint, könnte daher der ideale Einstiegsmoment für antizyklische Longs sein - und sei es auch nur für eine Countertrend-Rallye im Bärenmarkt.
Countrywide ist gerade ausgebrochen und 6 % im Plus...
U.S. wholesale inventories getting leaner in Nov.
By Rex Nutting
Last update: 10:00 a.m. EST Jan. 10, 2008
PrintPrint Email Subscribe to RSSRSS DisableDisable Live Quotes
WASHINGTON (MarketWatch) - Higher oil prices sent sales of U.S. wholesalers up 2.2% in November, the biggest gain in more than two years, the Commerce Department reported Thursday. Inventories at wholesalers grew 0.6% in the month. With nominal sales rising much faster than inventories, the inventory-to-sales ratio fell to a record low 1.07 in November from 1.08 in October. The inventory-to-sales ratio was 1.17 a year ago. The gain in wholesale sales was, in part, an illusion of inflation. Petroleum sales jumped 8.9% in the month, the biggest rise in two years. The figures are not adjusted for inflation
Bearish Sentiment Can Fuel an Oversold Rally
By Helene Meisler
Street.com Contributor
1/10/2008 9:13 AM EST
So, who wants me to start complaining? I know you're out there! I'll get the complaints out of the way first so we can move on.
- Breadth was lousy.
- Up volume as a percentage of total volume was awful.
- New lows expanded.
- Oh, and the VIX never really got jumpy.
Now, let's focus on the oversold rally call I've had for the past few days now. As I have explained before, the oscillator I use is the 10-day moving average of the advance/decline line.
The NYSE's moving average is dropping negative days only six out of the next 10 sessions, so it's not that oversold. But if we use up volume and down volume instead, then we have eight out of 10.
If we use Nasdaq, then we have a major oversold reading. For the Nasdaq advance/decline, nine out of the last 10 days we drop negative readings. For Nasdaq volume, we have eight of the last 10 days.
Remember, this is a moving average. As we drop negative numbers, in order to get more oversold we must replace those negative numbers with lower negative numbers. If we replace the negative numbers with higher negative numbers or positive numbers, the oscillator rises. That is what we mean when we say oversold. It basically means we're losing the downside momentum.
Yesterday, I highlighted the put/call ratio's one-day extreme reading. But the 10-day moving average of the put/call ratio will drop readings in the 90s or 100s over the next 10 days, so the likelihood of a peak in this indicator is high. Peaks in this indicator are typically associated with oversold rallies.
The ISEE call/put ratio has been under 100% for four days in a row now. That doesn't make it wholly bullish, since I've seen it go six days with such low readings, but at least it means these folks have finally pulled in their horns. And yesterday's action didn't change their newfound bearish view.
Anecdotally, my mother hasn't called. That might just be because she's been on vacation! Or is that rationalizing an indicator?! Nah, I think it's because we know this is just an oversold rally and not an intermediate-term low.
But I did notice another anecdotal item I'd like to share with you. I used to listen to Larry Kudlow's show each night when it was on shortly after the close. Since his guests tended to lean bullish, I found it was a great sentiment indicator to hear the bulls defend their stance in times of market declines. With Larry's show moving to such a late hour, I rarely watch it now. However, in its place I listen (I'm too busy posting my charts to watch) to "Fast Money."
I will refrain from any commentary regarding that show because it would likely not be favorable. However, they used to have a segment that annoyed me to death. They called it "Happy New 52-Week High". They would give you all these clues as to what it was and go to a commercial break and you were supposed to guess what stock it was. (It was usually so easy to figure out, but that's not the point.)
What annoyed me was how they would say, 'If you'd bought this stock six months ago you'd be up x%." How absurd is that? Why not just say, 'Woulda, coulda, shoulda'?! It's not like they had recommended the stock six months earlier.
In any event, I note that they seem to have stopped this segment this week. Now, maybe they stopped it because others found it as annoying as I did and complained loudly. But I notice they changed the name to something like "Trader Radar." And this week they keep highlighting stocks that were down big on the day rather than stocks on the new-high list (and yes, there are still plenty of stocks on the new-high list; yesterday the NYSE had 44 and Nasdaq had 20).
I find it interesting that they finally decided to stop showing us stocks at new highs and instead they started showing us stocks that drop. Did these folks really turn so bearish that fast? One has to wonder.
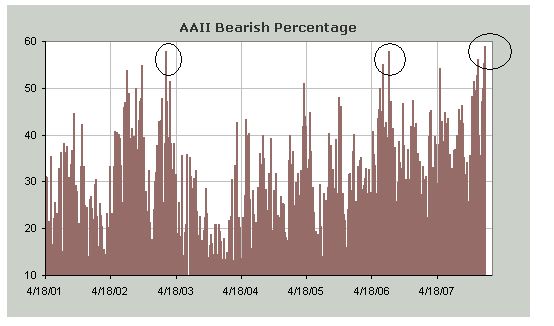
On to other measure of sentiment: most of you know I am not a fan of the weekly survey put out by the American Association of Individual Investors, mostly because I don't think they are investors but more like daytraders. Secondly, their survey is not done with a consistent number of respondents the way the Investors Intelligence readings are.
However, when these numbers get extreme, I take notice. This week's readings show bulls chiming in at 19.63%, which is the lowest reading since April 2005. We made a low in the market within a week of that extreme reading. But the bears are what I found truly amazing. They were at 58.88%, and I've gone back all the way to March of 2001 and cannot find another reading this high.
There are two other readings that are in the neighborhood. 57.9% was the peak reading at the July 2006 low almost to the day. 57.8% was the peak reading exactly one month before the March 2003 low (for those who don't remember such arcane details, we actually made a low in mid-February 2003, had an oversold rally and came back down in early March to a lower low, which was the ultimate low).
The bottom line? Sentiment is too extreme based on the put/call ratio and the AAII readings, as well as my anecdotal musings.
Keep in mind that we're still only talking about an oversold rally, but it probably needs to entice a few more folks back in before it can fail.
Angehängte Grafik:
screen_00326.jpg (verkleinert auf 92%)
screen_00326.jpg (verkleinert auf 92%)
dann aber mal Butter bei die Fische;
wo liegt das Potential im Dow für diese Sucker's Rally Deiner Meinung nach?
Optionen
| Boardmail an "obgicou" |
Wertpapier: S&P 500 |
Optionen
| Boardmail an "Andreano" |
Wertpapier: S&P 500 |
Angehängte Grafik:
1.jpg (verkleinert auf 78%)
1.jpg (verkleinert auf 78%)
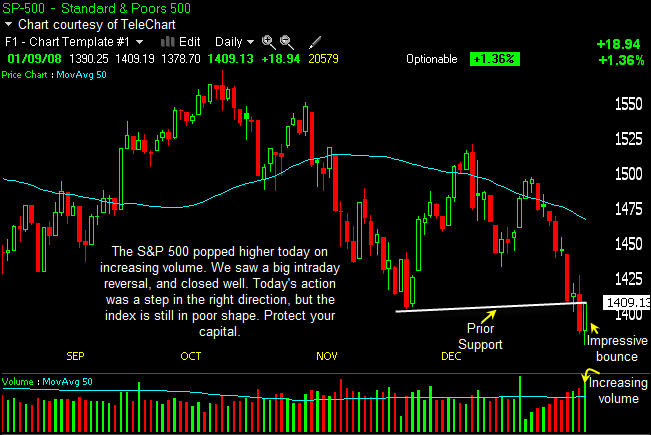
Kommt dir das bekannt vor?
Im Frühjahr haben wir das schonmal durchexerziert, nur umgekehrt: "Die Kurse sind so schnell hochgeschossen, jetzt MUSS es ja mal runtergehen!" Und? Viel Geld beim Shorten verbrannt!
Ich kann nur vor blauäugigem "antizyklischen" Longgehen warnen! Der Zeitpunkt für Long kommt noch. Aber vorher sollte man sich sicher sein, dass der Boden wirklich gefunden wurde und man nicht unversehens ausgestoppt wird. Zum Mitschreiben: Wir befinden uns offiziell in der Baisse!
Das Marktsentiment sagt mir, dass der Zeitpunkt für Longs in USA noch nicht gekommen ist (im Dax sowieso nicht). Die Rallys nach oben sind sehr scharf, deuten also nicht auf nachhaltige Käufe von Hartgesottenen sondern auf Short-Squeezes von der Futures-Seite aus hin. Ein starker Einbruch hat immer eine ausgeprägte Bodenbildung zur Folge, in diesem Fall könnte es ein Doppeltief werden.
Fazit: Es bleibt Zeit genug für Longs, wenn man nicht auf das letzte Prozent heiß ist (was eh nicht gelingt), abwarten und Tee trinken ist angesagt.