Der USA Bären-Thread
Seite 314 von 6257 Neuester Beitrag: 06.07.25 13:32 | ||||
| Eröffnet am: | 20.02.07 18:46 | von: Anti Lemmin. | Anzahl Beiträge: | 157.419 |
| Neuester Beitrag: | 06.07.25 13:32 | von: Frieda Friedl. | Leser gesamt: | 25.594.392 |
| Forum: | Börse | Leser heute: | 3.572 | |
| Bewertet mit: | ||||
| Seite: < 1 | ... | 312 | 313 | | 315 | 316 | ... 6257 > | ||||
Schon komisch. Verbraucherzahlöen waren ja nicht umwerfend. Aber jetzt werden wohl wieder feuchte Zinssenkungsträume gefeiert.
Mal abwarten, wie die noch schließen.
Optionen
| Boardmail an "Casaubon" |
Wertpapier: S&P 500 |
Optionen
| Boardmail an "relaxed" |
Wertpapier: S&P 500 |
Oder kommen die heute nicht mehr aus Ihrer Höhle ?
Optionen
| Boardmail an "Jorgos" |
Wertpapier: S&P 500 |
Investing
Charts Show More Downside Risk Ahead
By Mark Manning
Street.com Contributor
10/12/2007 10:27 AM EDT
The market experienced a broad selloff on increasing volume yesterday immediately following an analyst report on a market leader Baidu.com (BIDU). The Nasdaq took the biggest hit, dropping 1.4% on heavy volume. Next in line was the S&P Small-Cap 600 Index, which dropped almost 1%.
Many stocks have staged tremendous run-ups since the markets follow-through day on Aug. 29. It is very normal for stocks to take a rest after they have had sharp price gains. The question on most investors' minds is whether this is the start of something more intense than just a slight pullback in the market.
To answer that question, we will take a look at the charts of the major indices and one of my favorite overbought/oversold indicators, the percentage of stocks above their 40-day moving averages.
Let's first take a look at the Nasdaq Composite index, since it took the biggest hit. You can see from the chart that the Nasdaq broke to new all-time highs earlier in the day, and then quickly sold off, creating a key reversal day.
A key reversal day on the indices or a stock often marks a short- to intermediate-term top. A confirmation of the move often appears within a few days of the actual reversal. If traders immediately ignore the day and send stocks and the indices higher, then the signal is abandoned.
At this point, the reversal in the Nasdaq along with the heavy volume increases the chance that we will probably see a correction down to at least the 2650 area.
(CHART UNTEN)
The Dow Jones Industrial Average also experienced a selloff of about 0.45% on increasing volume. I wouldn't classify this as a key reversal day, but it does look like the Dow is going to experience some downside testing. The likely targets would be somewhere between 13,500 and 13,750.
(CHART IM NÄCHSTEN POSTING)
If you adhere to Dow Theory, you would have liked to have seen the Transports confirm the recent move of the Industrials. In a healthy bull market, you want to have both indices hitting new highs. You can see from the chart below that after the July-August selloff, the Dow Jones Transportation Average failed to break back above the long-term 200-day moving average.
One explanation for the lack of follow-through in the Transports could be the high price of oil. If companies that transport goods cannot pass along their fuel prices to their customers, it cuts into their profit margins and in turn lowers earnings, which hurts the stocks. Airlines especially bear the brunt of increasing oil prices.
The S&P Small-Cap 600 Index looked like it was ready to break out to new all-time highs when it quickly reversed at the resistance that was formed last June and July. This would be classified as a key reversal, and we are likely to see a pullback to around $69 or $70.
Last but not least is one of my favorite indicators, which is consistently accurate at predicting intermediate tops and bottoms. The percentage of stocks above their 40-day moving averages has been approaching an overbought condition over the last couple of weeks.
On Sept. 21, I said that the recent bounce was so strong that it moved the indicator from very oversold to overbought in a matter of days. I suggested that we had to be prepared for some profit-taking.
That is now happening, and you can see that the indicator is starting to roll over to the downside.
The selloff on Thursday, accompanied by a key reversal in many stocks, doesn't mean investors should run out and sell all of their holdings. It just means that you should take precautions to protect your profits and adjust your sell stops to protect your portfolio.
After you have a parabolic run like we have seen over the past couple of months, it's normal to work off the excess through a normal correction.
NASDAQ-CHART
Angehängte Grafik:
43211.gif (verkleinert auf 99%)
43211.gif (verkleinert auf 99%)
By Chris Schumacher
Street.com Contributor
10/12/2007 10:23 AM EDT
Thursday's pressure in the Nasdaq 100 finally notched a potential shift in investor sentiment that we haven't seen since the Fed cut rates. Prior to Thursday's trading session, it didn't matter what the news was. Traders would bid the markets higher because no one wanted to miss the train leaving the station. It was less about news and more about the simple need to be in the market from a profit standpoint.
But days like Thursday reiterate a point I made earlier this week: Chasing markets higher and higher can still provide a profit, but there's a real risk of buying a top and being part of a selloff (like Thursday's) that quickly takes a chunk out of your portfolio.
General Electric's (GE) just-released earnings didn't send the futures in any particular direction, and the PPI data released at 8:30 a.m. EDT weren't exactly positive. Given that the selloff was stemmed in part by Axel Weber's comments regarding inflation in Europe, I'd say to focus on whether investors begin consistently punishing bad news to see if Thursday was just a one-day profit-taking rout.
The real issue is whether the sentiment shift moves to the other extreme and investors begin selling good news. That would confirm the shift in the market behavior.
The major issue for the NDX Thursday was selling pressure in Baidu (BIDU) after JPMorgan reduced its forecast for the company, moving from a high near $360 to a low near $300 and sparking some much-anticipated tech-related selling.
The Nasdaq 100 was not immune as it finally filled a gap. This hasn't happened much in the last three weeks. Granted, it was a morning gap at 2180, but at least it filled. However, selling pressure couldn't push the index back to the next gap level that occurred between 2105 and 2120. If the bears are going to try to raid the index today, they will need to confirm the gap fill between 2105 and 2120 by testing 2105.
I will use NDX 2130 to 2160 as an early range, looking for the half-hour lows to offer a trend continuation signal rather than a reversal situation. This is a marked shift from the traditional half-hour setup, so stop-loss levels should be a little tighter. Ideally the index can touch 2105 by the end of the day today and wash out a few more of the early week's buyers who have yet to sell any new positions taken on this week. A move above 2165 today would show more strength than I expect.
Angehängte Grafik:
43210.gif
43210.gif
Kommentar von Dan Fitzpatrick (Street.com):
Baidu was on everybody's screens today [gestern, A.L.], trading 20 million shares. That's a lot of shares changing hands between $300 and $350. As such, the most prevalent emotion in the crowd right now will be found at the extreme edges of this range.
If the stock falls below $300, Thursday's dip buyers are likely to run for the exits and put pressure on the stock. At the same time, those who sold Thursday are not likely to jump back into the fray without some serious reservations. So I'd watch the 50-day moving average for the next potential buying opportunity.
And be mindful that the stock could either fall down to the 50-day moving average or just mark time until the 50-day moving average finally rises up to meet it. Either way, I'd focus on this key moving average if current support breaks down.
Angehängte Grafik:
43212.gif
43212.gif
Optionen
| Boardmail an "Jorgos" |
Wertpapier: S&P 500 |
Jean-Claude T.
Optionen
| Boardmail an "Casaubon" |
Wertpapier: S&P 500 |
Angehängte Grafik:
weber.jpg

weber.jpg
Wusste ich nicht.
Kann mir aber immer noch nicht vorstellen, dass seine Aussage gestern tatsäschlich die AMis schwer berührt haben soll. Die scheren sich doch normalerweise einen feuchten Dreck um die EZB.
Optionen
| Boardmail an "Casaubon" |
Wertpapier: S&P 500 |
Unserer (Yves Mersch) ist hierzulande etwas bekannt, da er unserem lieben Premierminister und tüchtigen Präsidenten der Eurogruppe (auch ein Jean-Claude) regelmäßig ans Bein pinkelt, sodass dieser wutentbrannt Merschs Mandatsverlängerung an der Spitze der hiesigen Zentralbank schon mal um mehrere Wochen hinauszögerte. Unser unfehlbarer JC mag nun mal keine fremden Götter neben sich.
Welche Bedeutung hat denn Weber bei euch? Ist der schon mal aufgefallen (außer gestern)?
Optionen
| Boardmail an "Casaubon" |
Wertpapier: S&P 500 |
Szenario A: Ich denke eher, dass wir kurz vor 22.00 Uhr das allfreitägliche Selling erleben.
Szenario B: Wenn's ganz komisch kommt, könnte es sogar sein, dass einige versuchen dann noch schnell bei apple wieder einzusteigen. (Nun gut, du weißt ja, dass ich zu jenen gehöre, die glauben, bei apple bestehe noch ein immenses Aufwärtspotenzial).
Rein gefühlsmäßig sieht's mir nicht so nach einer Wiederholung des gestrigen selling-offs aus. (Nur mein Schweinebauchgefühl ;-)
Nix genaues weiß ich auch keineswegs nicht lol
Optionen
| Boardmail an "Casaubon" |
Wertpapier: S&P 500 |
Optionen
| Boardmail an "Ischariot MD" |
Wertpapier: S&P 500 |
Angehängte Grafik:
beas6m.png (verkleinert auf 85%)
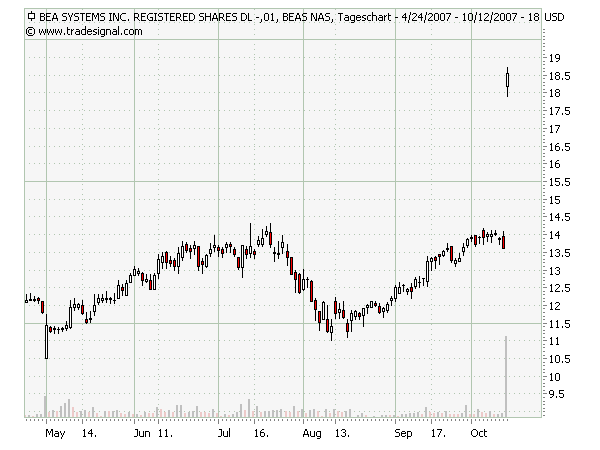
beas6m.png (verkleinert auf 85%)
(Die wollen sich anscheinend scheiden lassen - kein Witz. Die französische Presse ist voll davon und der Elysée will kein Kommentar abgeben)
Optionen
| Boardmail an "Casaubon" |
Wertpapier: S&P 500 |
Angehängte Grafik:
060729192244.jpg (verkleinert auf 99%)

060729192244.jpg (verkleinert auf 99%)
By Rev Shark
10/12/2007 2:01 PM EDT
The bounce action is starting to fade a bit, but market players certainly aren't acting like they were waiting for some strength to pare back on positions.
Typically, the reason you don't expect markets to put in V-shaped bounces is because the folks who were caught in the original spike down often look to pare positions subsequently in order to avoid another such unpleasant experience. A bounce allows a more graceful exit after you've suffered a nasty reversal like yesterday's.
However, in this market, the mentality of players tends to be that the spike down was just an aberration and that any weakness is a buying opportunity. Few seem very worried that a meaningful downtrend may actually reoccur.
[Hab meine SP-Puts sicherheitshalber mit kleinem Gewinn verkauft, will die nicht über's WE halten. - A.L.]
There have been a number of debates in Columnist Conversation about a "negativity bubble." Some of the bulls say that the level of negativity has been extremely high, and that justifies the market going higher.
If you consider the way stocks have acted technically, that certainly is a questionable assertion. We certainly have plenty of very clear reasons to be negative, but market players are not acting the least bit worried. If they are negative, they are doing a very good job of hiding it.
We are holding up well, and there are few signs of any anxiety to exit positions [bei den longs ;-)) A.L.]. I suspect we'll hold reasonably well as investors grow optimistic once again and anticipate earnings reports next week.
http://www.debka.org/headline.php?hid=4665
so long
navigator
Optionen
| Boardmail an "NavigatorC" |
Wertpapier: S&P 500 |